


The World Bank recently published a report analyzing public infrastructure investment in Mongolia (highlights here).1 The authors of the report argue that as the economy grows the challenge of scaling up the country’s infrastructure in cost-effective and targeted ways will be a significant determinant in whether Mongolia avoids the dreaded “resource curse.”
Mongolia’s current transport and energy systems are inadequate to meet present, let alone future, needs, dragging down productivity and pushing up costs in every sector of the economy. The report puts in words and graphs what is clearly visible in everyday life, that for a country with jaw-dropping GDP growth there is a serious infrastructure problem.

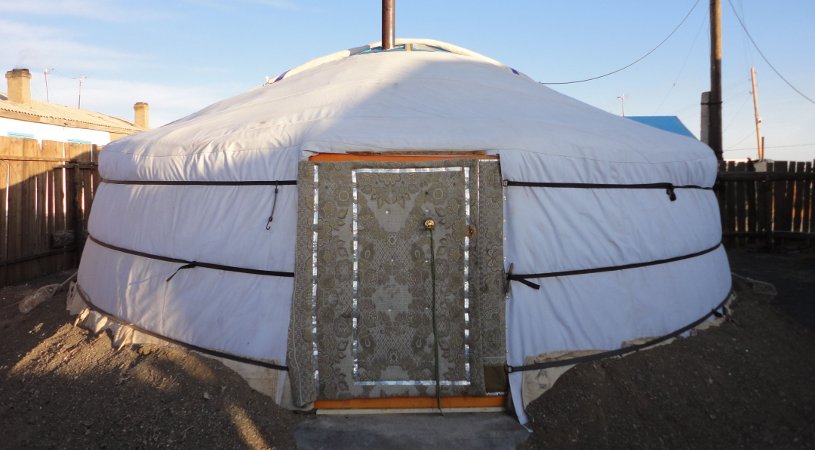
Khankhongor Soum ‘taxi’ c. 2004. One of only two vehicles in town then.
The authors describe public financing in infrastructure as suffering from a “build-neglect-rebuild” syndrome in which maintenance of current systems is ignored in favor of comparatively more expensive and sometimes unnecessary new construction.2 Budgeting for construction is not well managed, and a startling example of this is that 50-60 percent of capital expenditures occur in the last quarter and 30 percent in the last month of each fiscal year as government agencies try to expend funds on hastily started or incomplete projects to ensure unused funds are not returned the central budget.3 According to the authors, this is part of an overall lack of strategic focus and prioritization towards infrastructure projects in “growth poles,” places such as Ulaanbaatar, Orkhon, and Umnugovi where concentrations of population and business activity offer opportunities to leverage capital resources to further fuel economic development. In spite of the importance of these “growth poles,” the authors describe them as suffering from relative neglect.4
The authors’ critique brings to mind a humorous line from the woefully under watched American television show called “Parks and Recreation.” In one episode, a character named Tom Haverford is asked by a friend why his public relations consulting firm went bankrupt after only a few months even though he and his partner had started with 450 thousand dollars in capital. He replies, “People always say you have to spend money to make money. And, we were spending money like crazy. I don’t know what went wrong.” And, indeed, they were spending money like crazy on things like gift Ipads for visitors, an in-office DJ, and two NBA stars that played one-on-one basketball in the office to keep the firm’s image up. Investments in business plans, product development, market research, and competent staff, some of the “growth poles” of good business management, were ignored by Tom and his partner as things they considered only business geeks cared about, leading to the predictable result of bankruptcy.
This all provides a convenient backdrop for a new data widget on this site which lists development projects in Umnugovi province from 2008-2012. It’s not immediately obvious from the data that Umnugovi has dramatically changed over the last 4-5 years. The contrast between today and just a few years ago is dramatic. Eleven years ago when I first came to the provincial capital Dalanzadgad, the MIAT (yes, a domestic MIAT flight!) plane I was on landed on a dirt strip masquerading as a runway that today is covered by an expansive sports complex and convention center under construction. The town I currently live in had two vehicles a decade ago. Today the outside of the school gymnasium is lined with a dozen or more cars whenever there is a sports tournament. One early edition of the Lonely Planet guide described Dalanzadgad as a “wind swept, soulless town.” Today the province has 10,000 more people than it did a decade ago, and Dalanzadgad has the feel of a boom town in the old American West. You can buy fresh tofu and refried beans at stores in Dalanzadgad, for heaven’s sake! This is a changed province.
Umnugovi is identified in the World Bank report as one of the growth poles in the country, and the province does seem to qualify for the label. It has positive population growth and is a net contributor to the national budget, characteristics uncommon to the vast majority of provinces in the country. These are the result of Oyu Tolgoi and Tavan Tolgoi, of course, attracting people to relatively good paying jobs and providing the provincial government with taxes and fees. There is a palpable sense that Umnugovi is going to prosper greatly in the coming decades.

Diagram 1. Tavan Tolgoi Chalco Deal vs. Umnugovi Infrastructure Budget
Examining the project data closely, however, does produce some surprises that seem in keeping with the World Bank’s troubling critique. For example, according the provincial government approximately MNT 96.6 billion (USD 69 million)5 was allocated from 2008 to 2012 towards infrastructure and equipment projects such as improving schools, hospitals, and government buildings, laying roads, constructing water systems, and purchasing official vehicles. This works out to about MNT 1.7 million (USD 1,212) per person over that period.6 Consider this amount in comparison to the MNT 106 billion (USD 75 million) that in 2011 alone Umnugovi contributed to the central budget from local revenue.7 Or, consider it in relation to Tavan Tolgoi which burned through approximately three and half times more money from July 2011 to January 2013 selling coal to the Chinese aluminium company Chalco for a loss.8 Then consider it against the initial investment in Oyu Tolgoi. If you assume a total expenditure of USD 6.2 billion over the last 3.5 years, then USD 69 million works out to approximately 15 days worth of expenditures for the mine. Or, a little more than the amount spent by the government per person over 4 years (USD 1,212) every 30 seconds!

Diagram 2. Oyu Tolgoi vs. Umnugovi Per Person Expenditures
Those comparisons make it look like a relatively small amount, and it arguably is. Yet, taken from another perspective, expenditures in 2012 were seven times greater than in 2008 with MNT 34.5 billion (USD 24.6 million) spent on projects last year. The World Bank report also includes an examination of the construction sector’s capacity to meet demand for infrastructure projects, and the conclusion drawn is that it does not currently have anywhere near the capacity required, which leads into arguments about changing immigration policy and opening projects to international bidding that I won’t go into here. The main point is that even if the government gained a strong strategic focus with clear priorities, there would still be a problem of meeting real construction demand. This makes the need for prioritization particularly acute.
The increase in spending in Umnugovi over the last four years has had a noticeable impact as described above. In the town I live, it is easy to spot some of the projects this money has paid for such as a new school dormitory, renovations to the kindergarten, and three greenhouses for growing vegetables. Yet, life is still hard here from a public infrastructure point of view. There are few graded dirt roads, and even fewer paved roads. Electricity is flowing for now, but over the last decade it has given the impression of being off more than on. And, the “luxury” of clean running water still seems decades away. It is easy to pity entrepreneurs and innovators struggling against a very hard environment for commerce.
Much of the benefit of the mines in the region still comes at an individual level from relatively good paying mining jobs and government salaries paid for by increased tax revenue rather than indirectly from investments in public infrastructure. As the authors of the World Bank report argue, this is something that needs to change to avoid the “resource curse.” Or, as the lesson of Tom Haverford teaches, you have to do more than just spend money to make money. You have to spend it on the right things and make sure you have the right mix of business geekiness to make it all work.
You can play with the Gobi Budget 2008-2012 data widget here.
Footnotes
1. “Mongolia: Improving Public Investments to Meet the Challenge of Scaling Up Infrastructure”, World Bank, http://www-wds.worldbank.org/external/default/WDSContentServer/WDSP/IB/2013/02/12/000442464_20130212140847/Rendered/PDF/749440REVISED00ic0Investment0Report.pdf, 2013, (accessed March 14, 2013).
2. Ibid, pg. 57.
3. Ibid, pg. 11.
4. Ibid, pg. 30.
5. Exchange rate of 1400MNT/USD used throughout.
6. (MNT 1.7 million)/person = (MNT 96.6 billion)/(56,930 people) – population data from 2010 census.
7. From the 2013 National Budget, pg. 16.
8. 3.6 = (USD 250 million)/(USD 69 million) from loan agreement referred to here: “Chalco Urges Erdenes TT to Honor Terms of Coal-Supply Accord”, Bloomberg News, http://www.bloomberg.com/news/2013-01-22/chalco-urges-erdenes-tt-to-honor-terms-of-coal-supply-accord.html, January 22, 2013.