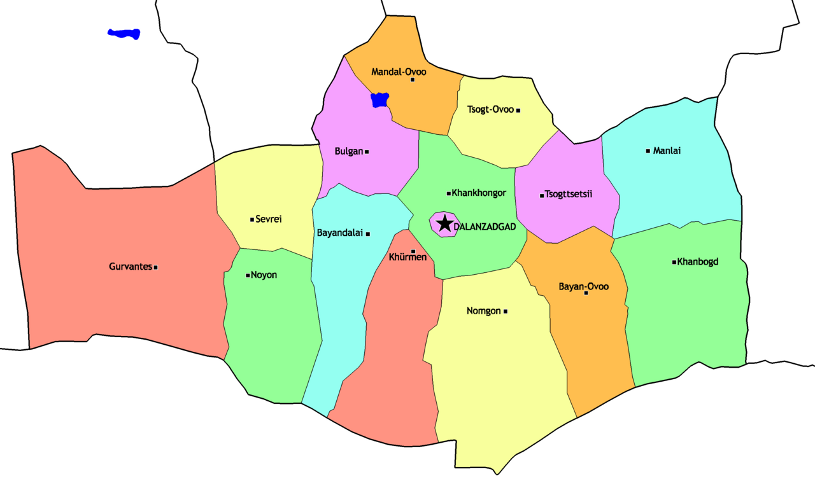


The Oyu Tolgoi (OT) copper mine is located within Khanbogd soum (county) in the far eastern part of Umnugovi province. The fact that OT is located in Khanbogd makes one assume the local citizens hit the jackpot (putting aside potential issues of the mine’s impact on traditional lifestyles and the environment).
Think of all the development projects and the associated government investment necessary to make Khanbogd a livable place in the future for all the mine’s workers and the support industry entrepreneurs and employees. With a population of over 7,000 people, Khanbogd is one of the largest soums in the province, and it will only continue to grow as OT begins to transition its mining staff away from being based in Ulaanbaatar to being based locally. This is the assumption, at least. But, I recently made a potentially troubling discovery while examining data on development projects conducted in the province.
The discovery is that Khanbogd, relative to other soums in Umnugovi, is receiving disproportionately lower levels of government investment, or “government pork” in political terms. Khanbogd appears to be the land that the Government of Mongolia forgot.
We start with a few basic premises. First, the Mongolian national budget is complicated, but in general it is structured in order to ensure equitable distribution of resources in every part of the country. Base expenses for covering government administrative, social welfare services, and public safety costs are allocated proportionally to provinces using fixed methods of calculation. If a province receives more in local income than its total base expenses in a given year, as Umnugovi has done over the last few years, then those funds are remitted back to the national level (although changes in the 2013 budget allow provincial governments to hold on to more of their surpluses if any). Conversely, if a province does not generate enough local income to meet base expenses, such as Arkhangai does each year, then that province receives additional funds from the national budget to shore up expenses. This puts all administrative units on an equal footing.
The second premise is that things become unequal as the national and provincial governments begin to allocate funds to special projects such as building roads, repairing power plants, and sponsoring cultural events. This can be uneven from place to place, and presumably the flow of these funds in part reflects the clout those areas have in local and national political decision making.
A final premise is that each Mongolian is entitled to an equal share of Oyu Tolgoi’s benefits. This premise is not logically necessary to generate the conclusion that Khanbogd is a forgotten land. Rather it is intended as a device for framing the conclusion. Each administrative government unit is entitled to a “fair share” portion of OT’s revenues based on its population. This portion of OT revenues can be thought of as the baseline for government pork. Keep in mind that we are talking strictly about government investment here and not direct private investment by OT itself in projects such as a recently opened community training center in Khanbogd.
Using data provided by the Umnugovi government, Oyu Tolgoi, and the National Statistics Office1, 2, 3, I created an investment ratio index, or “I-Ratio,” for ranking each soum’s level of government pork from the national and aimag (provincial) budgets relative to its population weighted portion of OT revenues. The expectation going into the ranking was that Khanbogd would rank in the top half of the index. To my surprise it was ranked 10th out of 14 soums in 2011, dead last in 2012, and dead last averaging both years for an estimate in 2013. Table 1 presents the estimate for 2013 based on the 2011 and 2012 levels of investments and the national budget estimate for OT revenues.
| Table 1. Investment Ratio Estimate Comparison for 2013 | |||||
|---|---|---|---|---|---|
| Rank | Soum | National Budget | Aimag Budget | OT Portion | I-Ratio |
| 1 | Manlai | 2,311.43 | 394.01 | 111.84 | 24.20 |
| 2 | Bayan-Ovoo | 1,868.66 | 179.41 | 88.02 | 23.28 |
| 3 | Noyon | 352.97 | 320.96 | 56.09 | 12.02 |
| 4 | Bayandalai | 635.71 | 450.12 | 107.70 | 10.09 |
| 5 | Khankhongor | 410.57 | 415.71 | 89.12 | 9.28 |
| 6 | Mandal-Ovoo | 469.97 | 92.72 | 86.53 | 6.51 |
| 7 | Tsogttsetsii | 105.77 | 2,382.22 | 396.00 | 6.29 |
| 8 | Tsogt-Ovoo | 380.10 | 78.35 | 84.93 | 5.40 |
| 9 | Khurmen | 219.49 | 232.01 | 85.87 | 5.26 |
| 10 | Sevrei | 318.34 | 224.13 | 104.28 | 5.21 |
| 11 | Bulgan | 401.25 | 122.37 | 112.28 | 4.67 |
| 12 | Nomgon | 390.94 | 178.33 | 145.86 | 3.91 |
| 13 | Gurvantec | 497.93 | 424.83 | 243.25 | 3.80 |
| 14 | Khanbogd | 98.37 | 670.74 | 394.29 | 1.96 |
| *National Budget, Aimag Budget, and OT Portion in millions MNT | |||||
An I-Ratio of 1 would mean a soum received exactly the same amount in government pork as that soum’s fair share portion of OT revenues. In Table 1 Khanbogd has an I-Ratio of 1.96 which means it received just under double its OT portion in government investment funds. Comparing this to Tsogttsetsii soum, which is of comparable size and also hit the jackpot with its own huge coal mine Tavan Tolgoi, it received over 6 times more investment from the Mongolian government than its OT share. Of course, because the I-Ratio is weighted by population, the results hold if you change the comparison to a per capita level of investment.
This analysis is necessarily incomplete due to the availability of additional data, but it does present a compelling piece of evidence that Khanbogd has not quite hit the jackpot in terms of government investment and revenues. In fact, comparing how it has faired to other soum’s, it is hard to escape the feeling that its development is prioritized well below other places by the government. More research is necessary to come to a firmer conclusion, but for now the available evidence indicates something is not quite right for a community that should arguably be experiencing the most benefit from OT’s development.
This may explain the articles and stories I keep seeing in the New York Times or on NPR with local Khanbogd citizens complaining they don’t see the benefit of the mine. I had generally assumed this was based on unrealistic expectations, but if the I-Ratio analysis is accurate, then they may just be expressing what the numbers suggest: so far the local benefits have been relatively underwhelming.
Table 1 above was generated using the “Khanbogd Investment Widget.” You can use the widget to generate lists ranking soums by their I-Ratio or on a per capita basis. There is also additional information about how the lists are generated.
Footnotes
1. Өмнөговь аймгийн засаг даргын тамгын газар, ‘Аймгийн засаг даргын мөрийн хөтөлбөрийн хэрэгжилт 2009-2012’, Даланзадгад 2012 он, p. 79-104.
2. Oyu Tolgoi, ‘Oyu Tolgoi in Numbers’, http://www.ot.mn/en/about-us/oyu-tolgoi-numbers.
3. National Statistics Office, ‘2010 Census by Soum and District’, http://www.toollogo2010.mn/doc/sum,duurgeer.pdf.