
There is always a palpable sense that the future is bright in Mongolia even if the present might appear dark. This sense is supported by data from the Sant Maral Foundation’s “Politbarometer” which regularly takes representative sample surveys of people in Ulaanbaatar and rural areas on a variety of political, social, and economic issues. The survey questions are fairly consistent, and since 2006 respondents have been asked to evaluate their “nearest future” as “optimistic” or “pessimistic.” Optimists have outnumbered pessimists in the surveys by a wide margin with an average of over 80 percent seeing a brighter future ahead.1
Optimism in Mongolia appears fairly stable. Graph 1 plots the proportion of responses that were “optimistic,” “pessimistic”, and “don’t know” or “no response” in the 10 surveys since October 2006. There is a slight upward trend with a few dips for optimism, and in recent surveys there have even been more “undecideds” than “pessimists.”

These numbers are impressively high but they’re not the highest in the world if you compare them to results from a survey of optimism in different countries conducted by the US polling organization Gallup. The comparison is not exactly apples-to-apples, because Gallup uses a “Cantril Self-Anchoring Striving Scale” which asks respondents to think of life conditions as a ladder in which 0 represents the worst conditions and 10 represents the best conditions and to imagine themselves on one of the rungs of that ladder.2 They are then asked to imagine where they’ll be on that ladder in five years. The difference with this survey is that people are not directly asked if they are optimistic but rather are categorized as such if they imagine themselves on a higher rung in the future.
A surprising result of the survey is that many relatively poor countries, especially in Sub-Saharan Africa, show higher percentages of “optimists” than in Mongolia.3 Togo, for example, in the most recent survey had 77 percent of respondents imagining themselves on rungs 0 through 4 in the present but over 90 percent of respondents imagining themselves on higher rungs in the future.4 In a place like Togo possibly there is a cultural superstition that to imagine a bad future is to invite a bad future. Or, on a more depressing level, maybe the terrible circumstances of the present gives people no other choice but to imagine a better future. In other words, how can things possibly get worse?
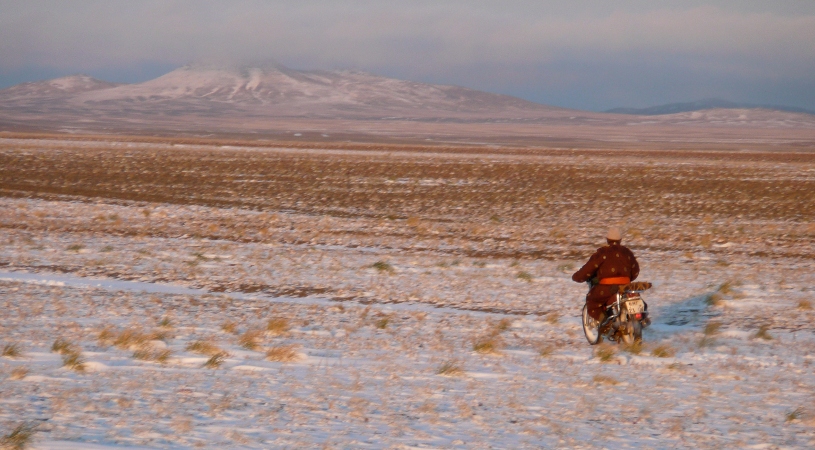
In Mongolia it is generally taboo to talk about dark things like death or accidents, so it is possible that people are outwardly optimistic to trick fate but inwardly harbor doubts. It is also possible that conditions are so bad that people have really no other choice but to think of the future as better as a matter of psychological survival. As I write this in a ger on a dark winter evening with the temperature outside dipping to -25C (-13F), I am also reminded that you almost have to be an optimist to survive winter here, so maybe the harsh conditions naturally weed out those with a dimmer outlook on life.
Optimism is more than just a feel good buzzword of the self-help industry. Dr. Martin Seligman, a psychologist and researcher at the University of Pennsylvania, has been a pioneer in studying the real world effects of the optimistic and pessimistic mindsets in the field of Positive Psychology. Controlled experiments and studies have demonstrated that optimists and those regularly feeling positive emotion on average have better life outcomes in a variety of areas from mental and physical health to improved work or school performance.5 If you consider yourself a pessimist, don’t despair (as you are apt to do). The research also shows that pessimists generally have better accuracy in estimating risks, providing over confident optimists with some much needed grounding.6 That said, however, the research points to more optimism leading to better outcomes overall.
It is hard to say what the reasons are for Mongolia’s high level of optimism, but I went back to the Sant Maral surveys to see if anything could be gleaned from how people have rated other aspects of their lives over time.
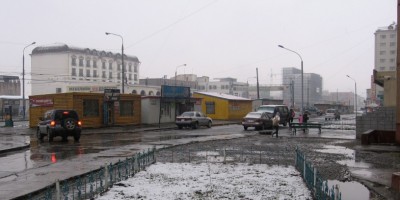
Graph 2 plots responses to a question about personal and family life situations. Neutral to positive responses include people who responded “very good,” “good”, and “partly good/partly bad.” Of those three options, the majority responded “partly good/partly bad” in each survey making up the bulk of the “Neutral to Positive Response” category. The negative responses include people who answered “bad” and “very bad.” In this graph there is an upward trend just like the question on optimism with a sharp dip in April 2010. There is a similar dip in “optimism” in Graph 1 for the same survey. In 2010 there was a “zud,” which is a type of severe weather phenomenon that comes in a variety of flavors and can kill livestock in large numbers. In 2010, millions of livestock died across the country as a result of the double whammy zud of a drought in the previous summer and severely cold and snowy conditions during the winter. For people in the countryside it was a particularly hard year economically, and people in Ulaanbaatar faced higher prices for staple foods produced from animals.

Graph 3 shows the economic impact on people in 2010 with a similar dip for the same survey for a question about the economic conditions in the country. In that survey respondents who see the economic situation in the country as “bad” or “very bad” outnumber those who see it as “very good,” “good”, or “partly good/partly bad” for the first time since the October 2006 survey.

Graph 4 plots responses to a comparison of “life development” to the previous year. This question is essentially asking if people are better off than they were a year ago. Neutral to Positive responses include people who answered “better” or “the same.” Negative responses are people who answered “worse.” This graph appears to track with the dips in optimism in Graph 1 fairly well possibly indicating that, as one might suspect, optimism in the present is dependent in part on what has happened in the recent past.

These three graphs suggest that optimism somewhat trends with economic conditions in Mongolia, and that people are constantly updating their assessment of the world based on recently past and current circumstances rather than just a simple adherence to a superstition, cultural norm, or coping mechanism. They suggest people are optimistic because they are in part naturally optimistic and in part because they have reasons to be optimistic.
Of course, this interpretation of the data contains significant bias on my part. It’s what I’d like to believe. A place full of optimism is by definition a hopeful place. It makes the uncertainty of the rapid economic and social changes occurring in the country less of something to fear and more of something to motivate the hard work necessary to bring about the brighter future people envision. At least that is what my own optimism tells me. A pessimist might have a different take.
Footnotes
1. Refer to Sant Maral Foundation, “Politbarometer”, (October 2006-June 2012).
2. Gallup, “Understanding How Gallup Uses the Cantril Scale”, http://www.gallup.com/poll/122453/Understanding-Gallup-Uses-Cantril-Scale.aspx.
3. Anna Machin, “Worldwide, Greeks Most Pessimistic About Their Lives”, http://www.gallup.com/poll/156137/worldwide-greeks-pessimistic-lives.aspx, (July 25, 2012).
4. Ibid.
5. See Positive Psychology Center, “Frequently Asked Questions – 4. Is positive psychology discovering anything surprising? Is this just stuff my mother knows?”, http://www.ppc.sas.upenn.edu/faqs.htm.
6. See Positive Psychology Center, “Frequently Asked Questions – 7. Are happy people stupid?”, http://www.ppc.sas.upenn.edu/faqs.htm.